
Let’s take the example of a hospital. A patient checks in the hospital and then waits for some time to be examined by the nurses and doctors depending on the criticality of the patient. Or alternatively a patient might have requested to be checked only by a certain specialist doctor.
Below is a process flow diagram for the above mentioned
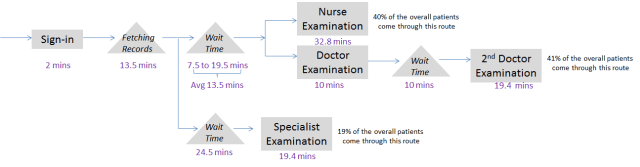
Now, calculate the overall wait and process times by doing a weighted average based on the number of patients arriving to the particular process flow. The calculations are as follows:

Lean Management says that all flow time should be value added time and there should be zero non-value added time (wait time). In this particular process, waiting time contributes to over 50% of the average flow time. So, we need to understand the reasons behind the high waiting time. To understand that, we will have to calculate what is the demand and capacity for each of the resources (doctors and nurses in this case).

The above demand and capacity is calculated through some given data about the hospital.
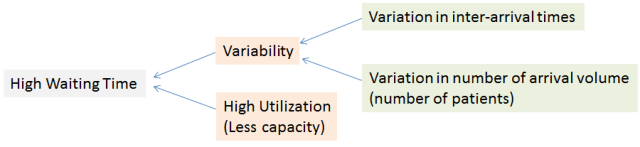
Theoretically, high waiting times are caused either because of high utilization (less capacity (bottlenecks)) or because of high variation in the arrival or input flow. In turn, high variation can be caused because of huge changes in input volume or because of variation in time intervals of arrivals.
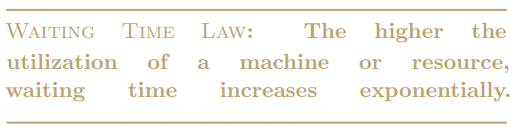
If capacity is the problem, then we add more capacity or do resource pooling. On the other hand, if high variation is the problem then we can take some design decisions such as appointment based checkups to schedule the arrival properly. In this particular case, we don’t have high variation in the input and hence we assume that the high waiting times are due to bottlenecks. Since doctors have are the least capacity resource, we say that doctors are the bottleneck.
Other inferences from the figure 2 are: the average flow time (59 min) of patients going for a specialist examination is less than those going for a general checkup (68.4 mins). Ideally, patients who want to meet only a particular specialist doctor should have more flow time as they are putting adding stress to the system by requesting a specific resource. One can also check such design issues using this flow time, capacity and utilization calculations.
For a nice discourse on waiting times, please refer http://healthcare.flexsim.com/wp-content/uploads/2014/02/BillNordgren_TheProblemWithWaitingTime.pdf
Little’s Law:
You can also Little’s law for other applications when arrival rates and capacities or waiting times are given.
Step 1: Calculate the arrival rates of the process
Step 2: Calculate the waiting time and processing time at all the respective places in the process
Step 3: Calculate how much of the waiting time is congestion driven and how much is due to the variation in inter-arrival times and variation in arrival volumes
Little’s Law says: The mean number of jobs in the system = Arrival Rate * Mean Waiting Time In The System
It can also be said as: the average queue length equals the average arrival rate times the average waiting time.
Alternatively: the average waiting time equals the average queue length times the average time between two arrivals.
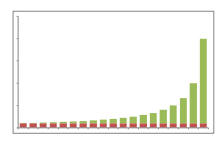
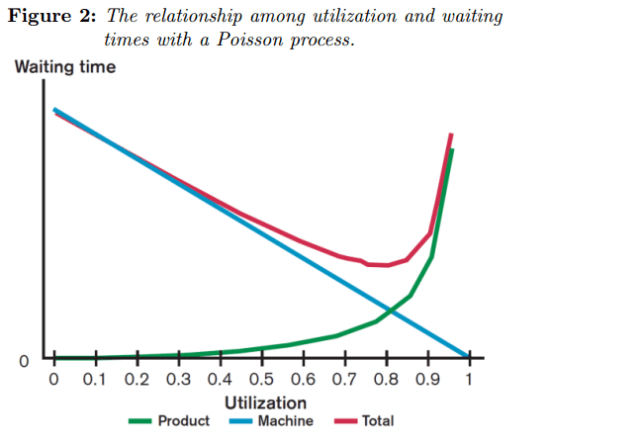
So whenever you are standing in a customer line, Little’s law allows you to estimate how long you still have to wait. Estimate how many people are in front of you, estimate how long it takes for each customer to be served (more accurately, you would estimate the inverse of the departure rate), and multiply these. The graph represents how the total time spent increases as the arrival rate increases to approach the maximum server capacity (i.e. the maximum departure rate).
To understand the business applications of the Little’s law and queuing theory, refer http://www.shmula.com/littles-law/8035/ and https://www.cmg.org/wp-content/uploads/2013/08/m_102_2.pdf

You must be logged in to post a comment.