

A session is a count of a user until the cookie of that user expires, and it is essentially a set of interactions by a user within a time frame. If you go to amazon.in and browse around a few products, you will register a session – 1 session. If you go to the product page, it will be counted as a page view for that particular product, leading to 1 session and 1-page view for that product page. If you go back to that product page again after 30 minutes, the product will have 2 page views and 1 session. In other words, sessions are the count of unique visitors to the website. Page hits and views are the same, and it is the count of the number of visits to a page.
If your product page had 10 sessions yesterday and 24 page views, that means each session (visitor) averaged 2.4 visits to the product page. For how long a user will be counted in one session depends on how the cookies are configured – some expire in 24 hours, others in a week. For example, the page view cookie is set at 24 hours. The sponsored product cookie is set for a week. Of course, if the viewer decides to clear his cookies this will refresh his count.
Page views per session indicate the ability of your website to engage the user and obviously higher this metric the better it is for business indicating good product, good catalog quality leading to better conversions. When we start looking at this metric for various channels of traffic, you will start seeing significant differences in page-views per session across channels as shown below.
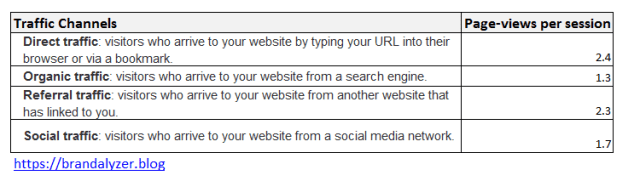
Some websites are not so bothered about repeat users and they only rely on bulk page views, whereas some websites are more interested in repeat users and engagement. So, depending on what the website’s goals are, the website owner should start measuring those relevant metrics. Some of the other crucial questions are:
- Are users returning to my website? Returning users have a high chance of being converted. Washington Post measured that users who came at least three times a month are 90% more likely to subscribe to the newsfeed in the next three months. New and Returning users are mentioned separately in Google Analytics.
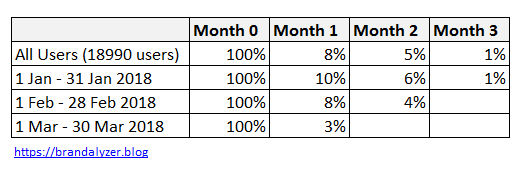
- Cohort analysis tells you the percentage of visitors you retain from the first visit. A customer cohort is a cluster or segment of customers who are grouped together by marketers in one bucket and then studied. In this example, 6% of the visitors who first visited in January also visited in March.
- Bounce rates and Session-durations – Session durations of a few seconds can indicate that users are not engaging and are just passing through or bouncing off.
Hope this is helpful, thank you!

You must be logged in to post a comment.