
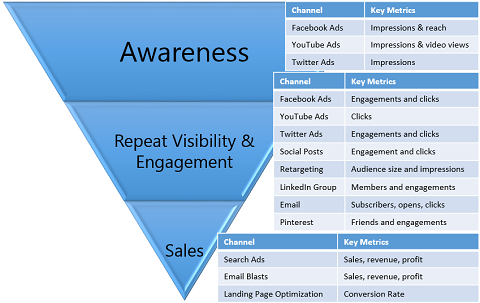
Rarely will a buyer click your advertisement, fill in the details, read a blog post, then purchase your product in one single continuous journey; the journey is just not that linear. Customers evolve w.r.t. their awareness, trial, usage and brand/product loyalty across time and across devices and platforms. Therefore, how you want to develop a touchpoint and what you want to communicate depends on the customer evolution stage. If you have to build awareness in a particular TG, then you will probably use top of the funnel (TOFU) activities and touch the customers on (search ads, impressions, etc.) and on the other hand you want to convert a customer who is already considering a product then you will probably use bottom of the funnel (BOFU) activities such as emailing a discount coupon.

Metrics at the top of the funnel measure prospect behavior, such as impressions, bounce rates, average time on site, and volumes of various types of web traffic. They are helpful when optimizing web pages for TOFU conversion rates, and they provide a general understanding of the health and effectiveness of a website. However, when it comes to impacting the bottom line, they don’t provide many down-funnel insights. Metrics around the middle of the funnel include open rates, click-through-rates, lead volumes, lead scores, and lead conversion rates by channel or landing page. These metrics help show you where your prospects are most often turning into more qualified leads. Metrics at the end of the funnel measure conversions, costs, win rate, and overall results based on opportunity conversions and closed-won customers. The TOFU, MOFU, and BOFU metrics are different for each of the channel (or consumer journey to the final conversion). Lower funnel metrics are generally far more insightful than the typical TOFU rate metrics but varies by the category and by the marketing objective.
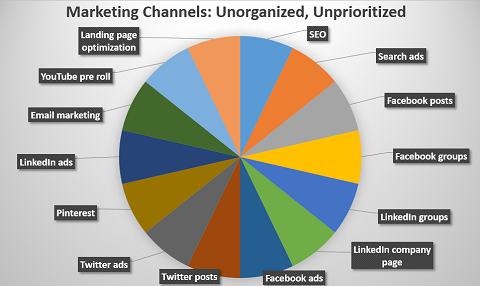
A real example of market-place traffic distributed across various sources of channels is as below.

A business or product can have multiple ways of acquiring potential customers. Each unique way or path of acquisition of customers is called the marketing channel and each channel has a unique funnel that starts from a large base and narrows down. Every channel has a funnel or a customer purchase journey. An effective funnel operates with this goal in mind: it moves visitors to leads, leads to opportunities, and opportunities to revenue, leaking as few people as possible at each transition. Each of these funnels has a first touch point that drives the purchase journeys (or purchase paths or funnels). Marketing is always optimizing on which marketing touches are driving those purchase journeys and which touches are not driving the journeys. A touchpoint is where you want to develop an interaction (using a search ad, display ad, other online or offline campaigns) with a potential target customer who you believe will be in the right psyche or mindset at that touchpoint for you to show a communication and drive him towards a favorable action (driving into the funnel). Therefore, while the medium of touchpoints is broadly the same (such as search ad, display ad, email, etc.), the criteria to decide the potential target customer and his/her psyche will be different for various customer target segments and products. A company selling ear-rings (say Estelle) might decide to touch customers even in an FMCG general store and might also decide not to touch customers with Facebook ads (probably because the customer psyche is not favorable or the communication is not driving a favorable action).
Each of these social marketing channels is one unique way to guide your prospects through the funnel. For each of these channels, the first marketing touch will be in various formats and that first marketing touch drives the funnel in that specific path.


But when we use multiple channels, it can be very difficult to come up with the correct attribution of which channel actually drove the conversion. When you bring together spreadsheets of channel-specific data, such as Facebook Insights reports or LinkedIn Ads Campaign Manager reports, the attribution data for each marketing channel is siloed separately, which creates the challenge of double-counting credit.
For example, if a visitor clicks on an AdWords ad on Monday, a Facebook ad on Wednesday, and then buys something for $100 on Friday, both your AdWords data and your Facebook data will claim 100% conversion credit. That’s because they don’t communicate with each other. When you bring both data sources into your spreadsheet and associate that conversion with its $100 value, your report will show $200 of revenue — 2x your actual revenue — a big, and potentially embarrassing problem.
Broadly, there are two ways in which marketers can attribute the sales back to the marketing touches: single touch attribution and multi-touch attribution models.
Single Touch Attribution: As the name suggests, in this model all the sale or conversion revenue is attributed to a single touch-point even if the consumer came through multiple touchpoints such as Facebook, Instagram, and Email. There are three common single touch models:
- First Click: When 100% of the revenue credit is attributed to the touch-point that drove the first click to the website.
- Lead Conversion Click: This is where 100% of the revenue credit is given to the action that drives the visitor to become a lead (i.e. give you their contact information by filling out a form). For example, if an anonymous visitor comes to your website multiple times (browsing your site) and downloads content on their
fifth visit, the channel that drove the fifth visit would receive 100% of
the revenue credit when that lead becomes a customer. - Last Click: This attribution model is similar to the Lead-Conversion Click model,
but it gives 100% of the credit to the marketing channel that drove
the engagement where the lead converted into an opportunity.
Although the single-touch models are the easiest to implement, they are actually quite flawed. Because each of these models gives 100% of the revenue credit to a single marketing channel, they don’t do a good job of representing the long and complex customer journey that typically spans multiple touchpoints and multiple channels.
By reducing the entire customer journey to a single touchpoint, these attribution models give rise to channel bias (also known as model bias). First Click attribution, for example, gives 100% of the revenue credit to the marketing channel that first brought the visitor
to your website, which is a top-of-the-funnel (TOFU) marketing activity, and it gives zero credit to the other marketing activities that affected the lead further down the funnel. Naturally, this over-values the importance of TOFU marketing activities and under-values middle-of-the-funnel (MOFU) and bottom-of-the-funnel (BOFU) marketing activities. Lead-Conversion Click attribution creates a similar channel bias, but for MOFU marketing activities — efforts that convert visitors into leads. It ignores marketing efforts that facilitate discovery, as well as lower-funnel activities that nurture the prospect from lead to customer. In order to eliminate channel bias, marketers should use multi-touch attribution models. They are harder to implement, but they are much better at properly attributing revenue across all your marketing channels to give credit where it’s due.
Multi-touch Attribution Models: As the name suggests, in this model the sale or conversion is attributed to multiple touch-points. Some of the popular methods of multi-touch attribution are:
- Linear: Linear attribution gives equal weight to every touchpoint. For
example, if there are three touchpoints that lead to a conversion,
each touchpoint receives 1/3 of the conversion credit. If there are ten
touchpoints that lead to a conversion, each touchpoint receives 1/10
of the conversion credit. - Descending (or Time Decay): A Descending attribution model attempts to address some of the oversimplifications by giving more credit to the touchpoints closer to
the conversion. - U Shaped: One of the simplest multi-touch attribution models is U-Shaped.
With U-Shaped, 40% of the revenue credit is applied to both the first
touch and the lead conversion touch with the remaining 20% being
applied evenly to all other touches. - W Shaped: It accounts for and emphasizes the major transitions in the customer journey: the first visit, the lead-conversion session, and the opportunity-creation session. By attributing 30% of revenue to each of those three major transitions, marketers are able to accurately make smart decisions based on which marketing efforts had a big impact. The remaining 10% is split among the touchpoints that were not responsible for any of the major transitions.
Through attribution, companies are able to do account-based marketing and reporting. Attribution connects everything back to revenue, which means it’s easy to see what areas are performing and which need more work, especially paid media.
Optimizing paid media through attribution
Paid media includes promoted social posts, display advertising, and pay-per-click campaigns. These areas tend to have a strong top-of-the-funnel impact, so this is where it’s even more important that your attribution solution is able to track anonymous first touch. Say a prospect comes to your site through a paid social post, reads an article or two and then leaves without filling out a form. They later come back through a display ad and sign up for your upcoming webinar. Without anonymous first touch tracking, the
display ad would get the credit, but really it was the paid social post that initially brought the prospect to your website. With this information, you can see which paid media campaigns are driving the most leads and track those leads to see which are
converting to customers. Invest in the outlets that are working and reduce spending on the ones that aren’t.
More broadly, the same can be done for campaigns and channels. Growing a business includes taking chances and the only way to tell if those chances have paid off is through attribution. If you’re investing in new channels and want to see what works best for your company, attribution is the solution. It shows which campaigns and channels are working best to drive the most revenue. From there, you can make smart budget decisions, moving money to effective campaigns and channels, and taking money away from efforts that are proving to be fruitless.
Hope this useful, thank you!
Source:
https://www.bizible.com/blog/marketing-funnel-metrics-infographic
https://www.marketo.com/lead-generation/
https://blog.marketo.com/2019/05/demand-generation-marketing-a-five-minute-guide.html

You must be logged in to post a comment.